
As Wasm adoption grows, easy monitoring and diagnosis of Wasm code in production will be critically needed. One of the biggest challenges we see is that existing observability tools do not work effectively, if at all, with Wasm. In this post we highlight this problem and explain exactly why this is the case. First we will explain how these systems work traditionally so we can better understand the architecture of these systems. Then we will describe a minimal Wasm function-as-a-service platform to explain where the challenges are.
How do observability tools work?
The end goal of all observability tools is to get telemetry out of our systems to some kind of centralized database (or platform) where we can store, query, and visualize the data. Telemetry typically consists of traces, metrics, and logs. Telemetry can be extracted from all levels of our stack through both manual or automatic instrumentation of the code.
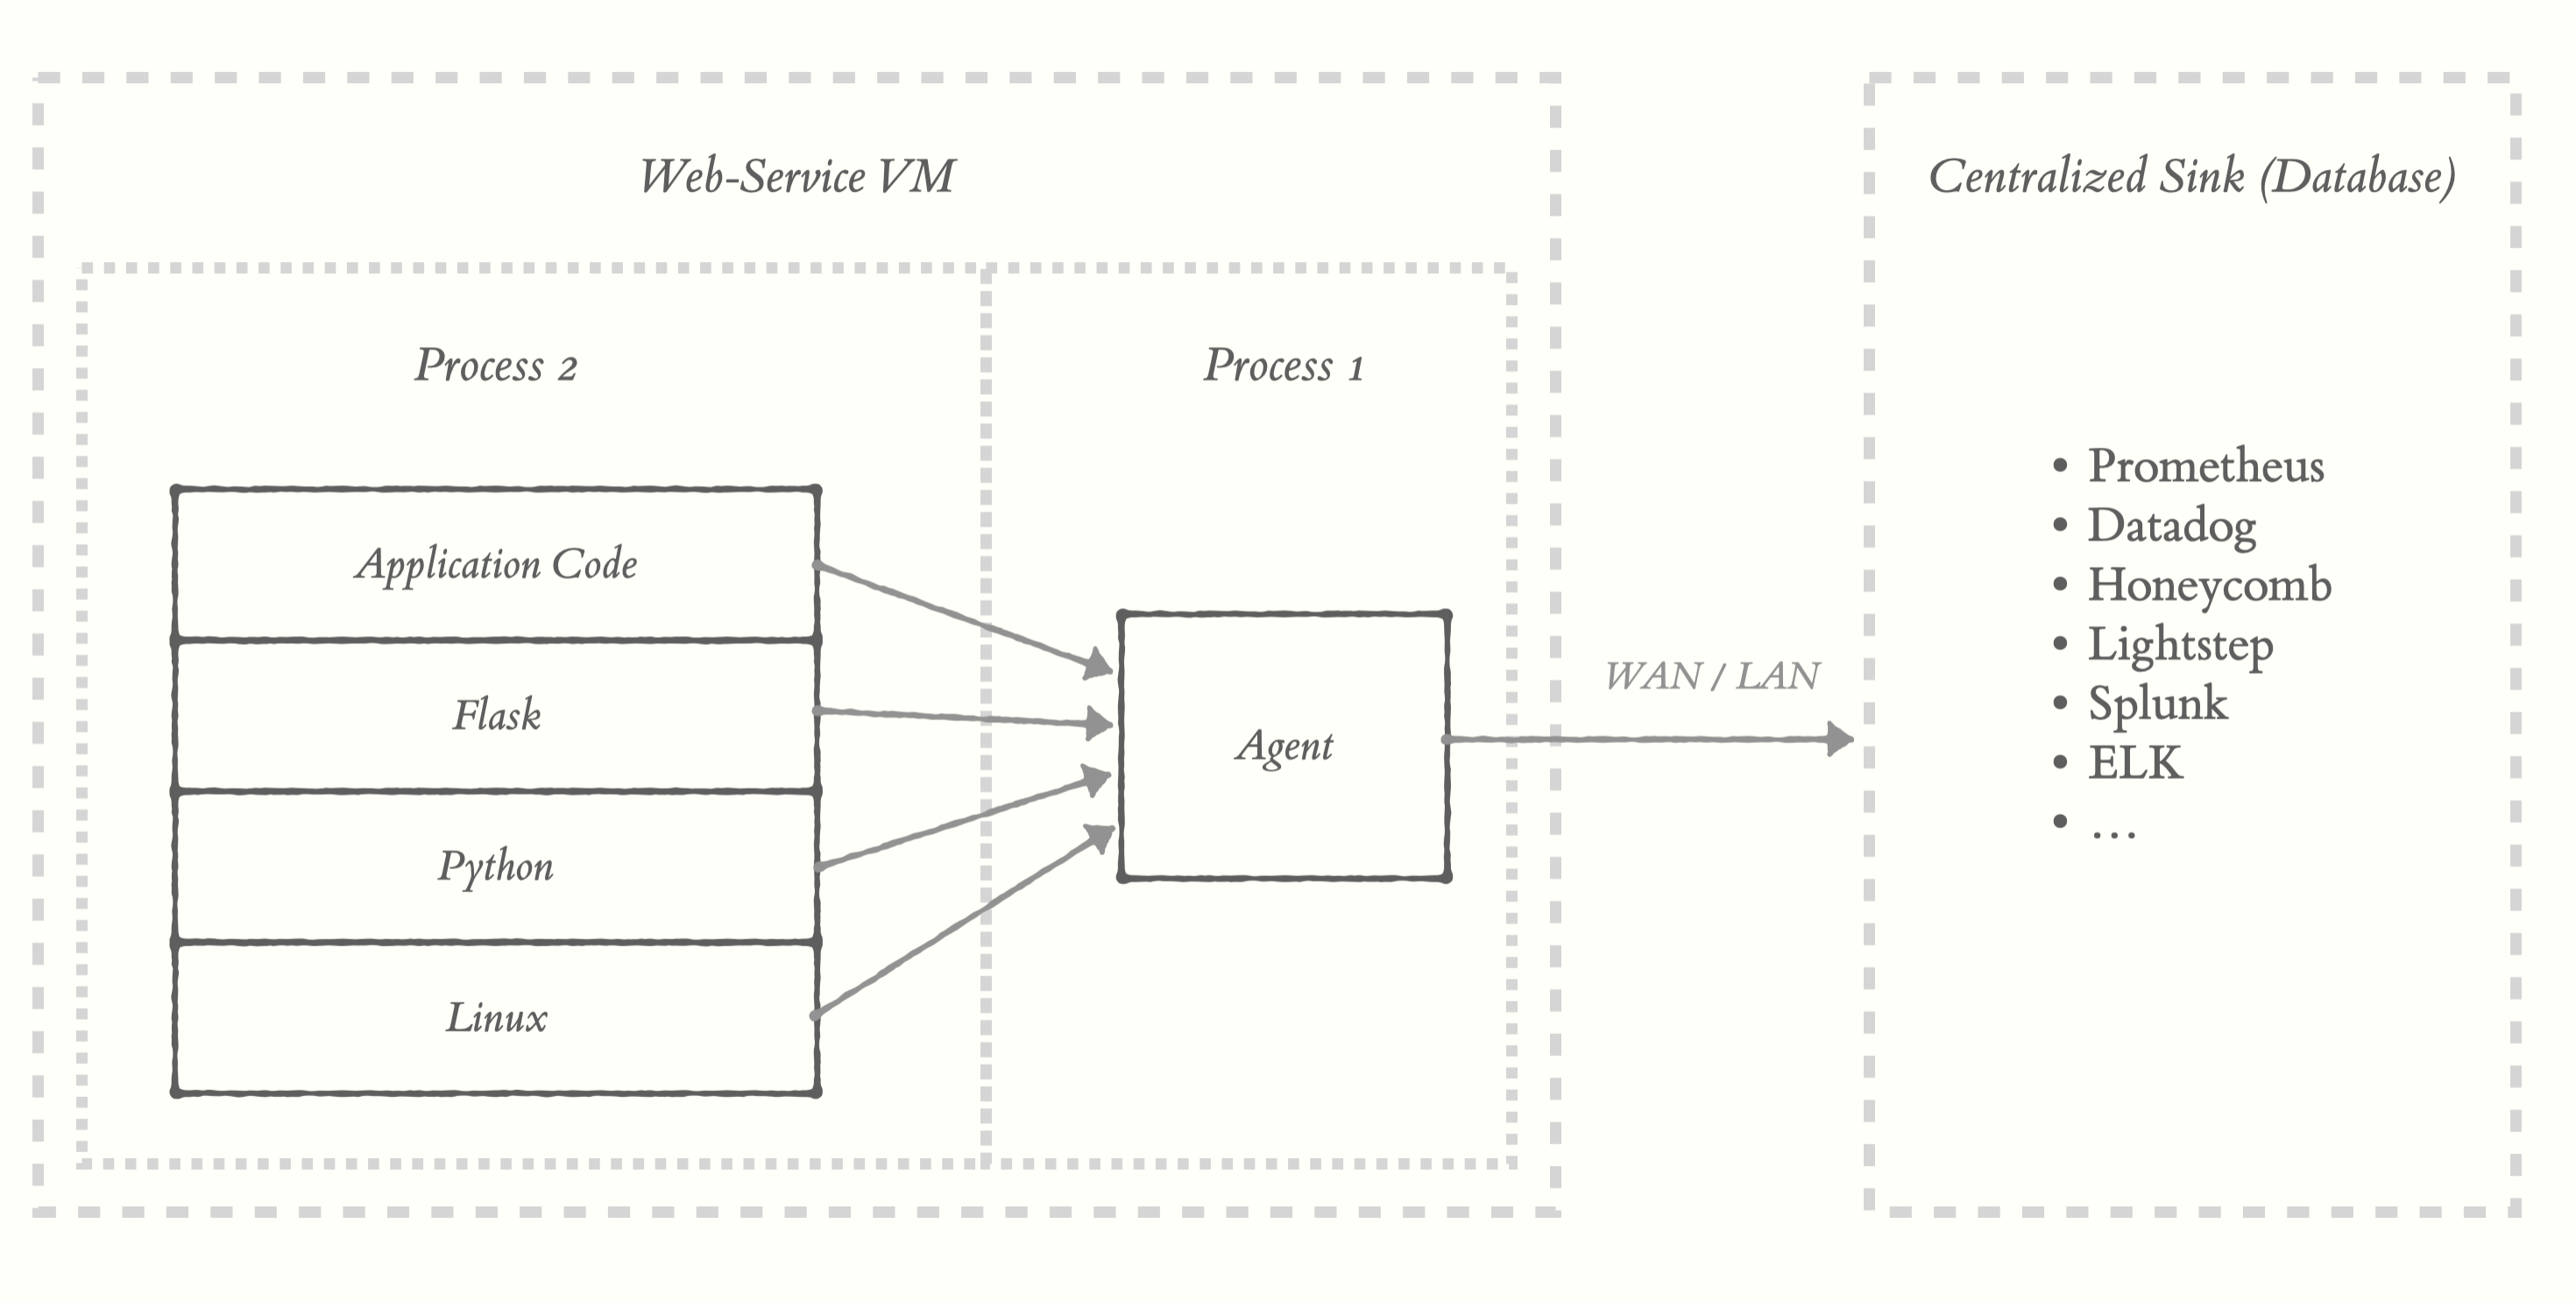
Let’s consider the example of a Python / Flask web service. A typical setup in these systems requires you to run an “agent” (or “collector”) in a separate process from your application that collects telemetry from your system. Your application’s processes emit telemetry to this agent using a variety of IPC interfaces. You can see here we get automatic telemetry from Python (e.g. metrics about memory allocation or garbage collection) and Flask (e.g. http metadata, latency, etc).
The agent can aggregate, sample, batch, compress, and send this data to the centralized sink in a performant way. In some cases, when you need to, you can send telemetry directly to the sink.
Challenges when using Wasm
Now that we’ve got an idea of how observability works in traditional systems today, let’s talk about Wasm. We’re going to do this by building a minimalist Wasm FaaS (Functions as a Service) system we’re calling Iota.
The host of Iota will be a rust application using the axum web framework. We will use wasmtime to execute the wasm modules. We only need two HTTP POST endpoints in our application, one to upload modules and one to run them:
  // Create Axum Routes
let app = Router::new()
        .route("/upload", post(upload))
        .route("/run", post(run_module));
The implementation of the
uploadandrun_modulefunctions is not important to understanding the problem, but you can find them here.
To keep things ultra simple, our programs will only have one function with one type:
f([u8]) -> [u8]
They will take an array of bytes as input and return an array of bytes as output. We will use WASI to accomplish this by mapping the HTTP request body to stdin on the module, and the stdout of the module to the HTTP response body.
Let’s assume we have a program that counts the number of vowels being streamed
into stdin. Let’s upload it to iota and run it using curl. To upload, we send a
multi-part request with the wasm module and use the query param name to
register this function with the name count_vowels:
  curl \
  -X POST \
  "https://iota.dylibso.com/upload?name=count_vowels" \
  -F wasm=@count_vowels.wasm
To run it, we just need to invoke it by name and pass our data as text to the
HTTP body, in this case the string "Hello, World!":
  curl \
  -X POST \
  "https://iota.dylibso.com/run?name=count_vowels" \
  -d "Hello, world!"

#=> 3
The response body should be “3” because there are 3 vowels in the input.
How do we add observability to this?
Here is where we get to the meat of our problem statement. To understand why we can’t just hook up our normal tools, let’s start by looking at the architecture of this new system:
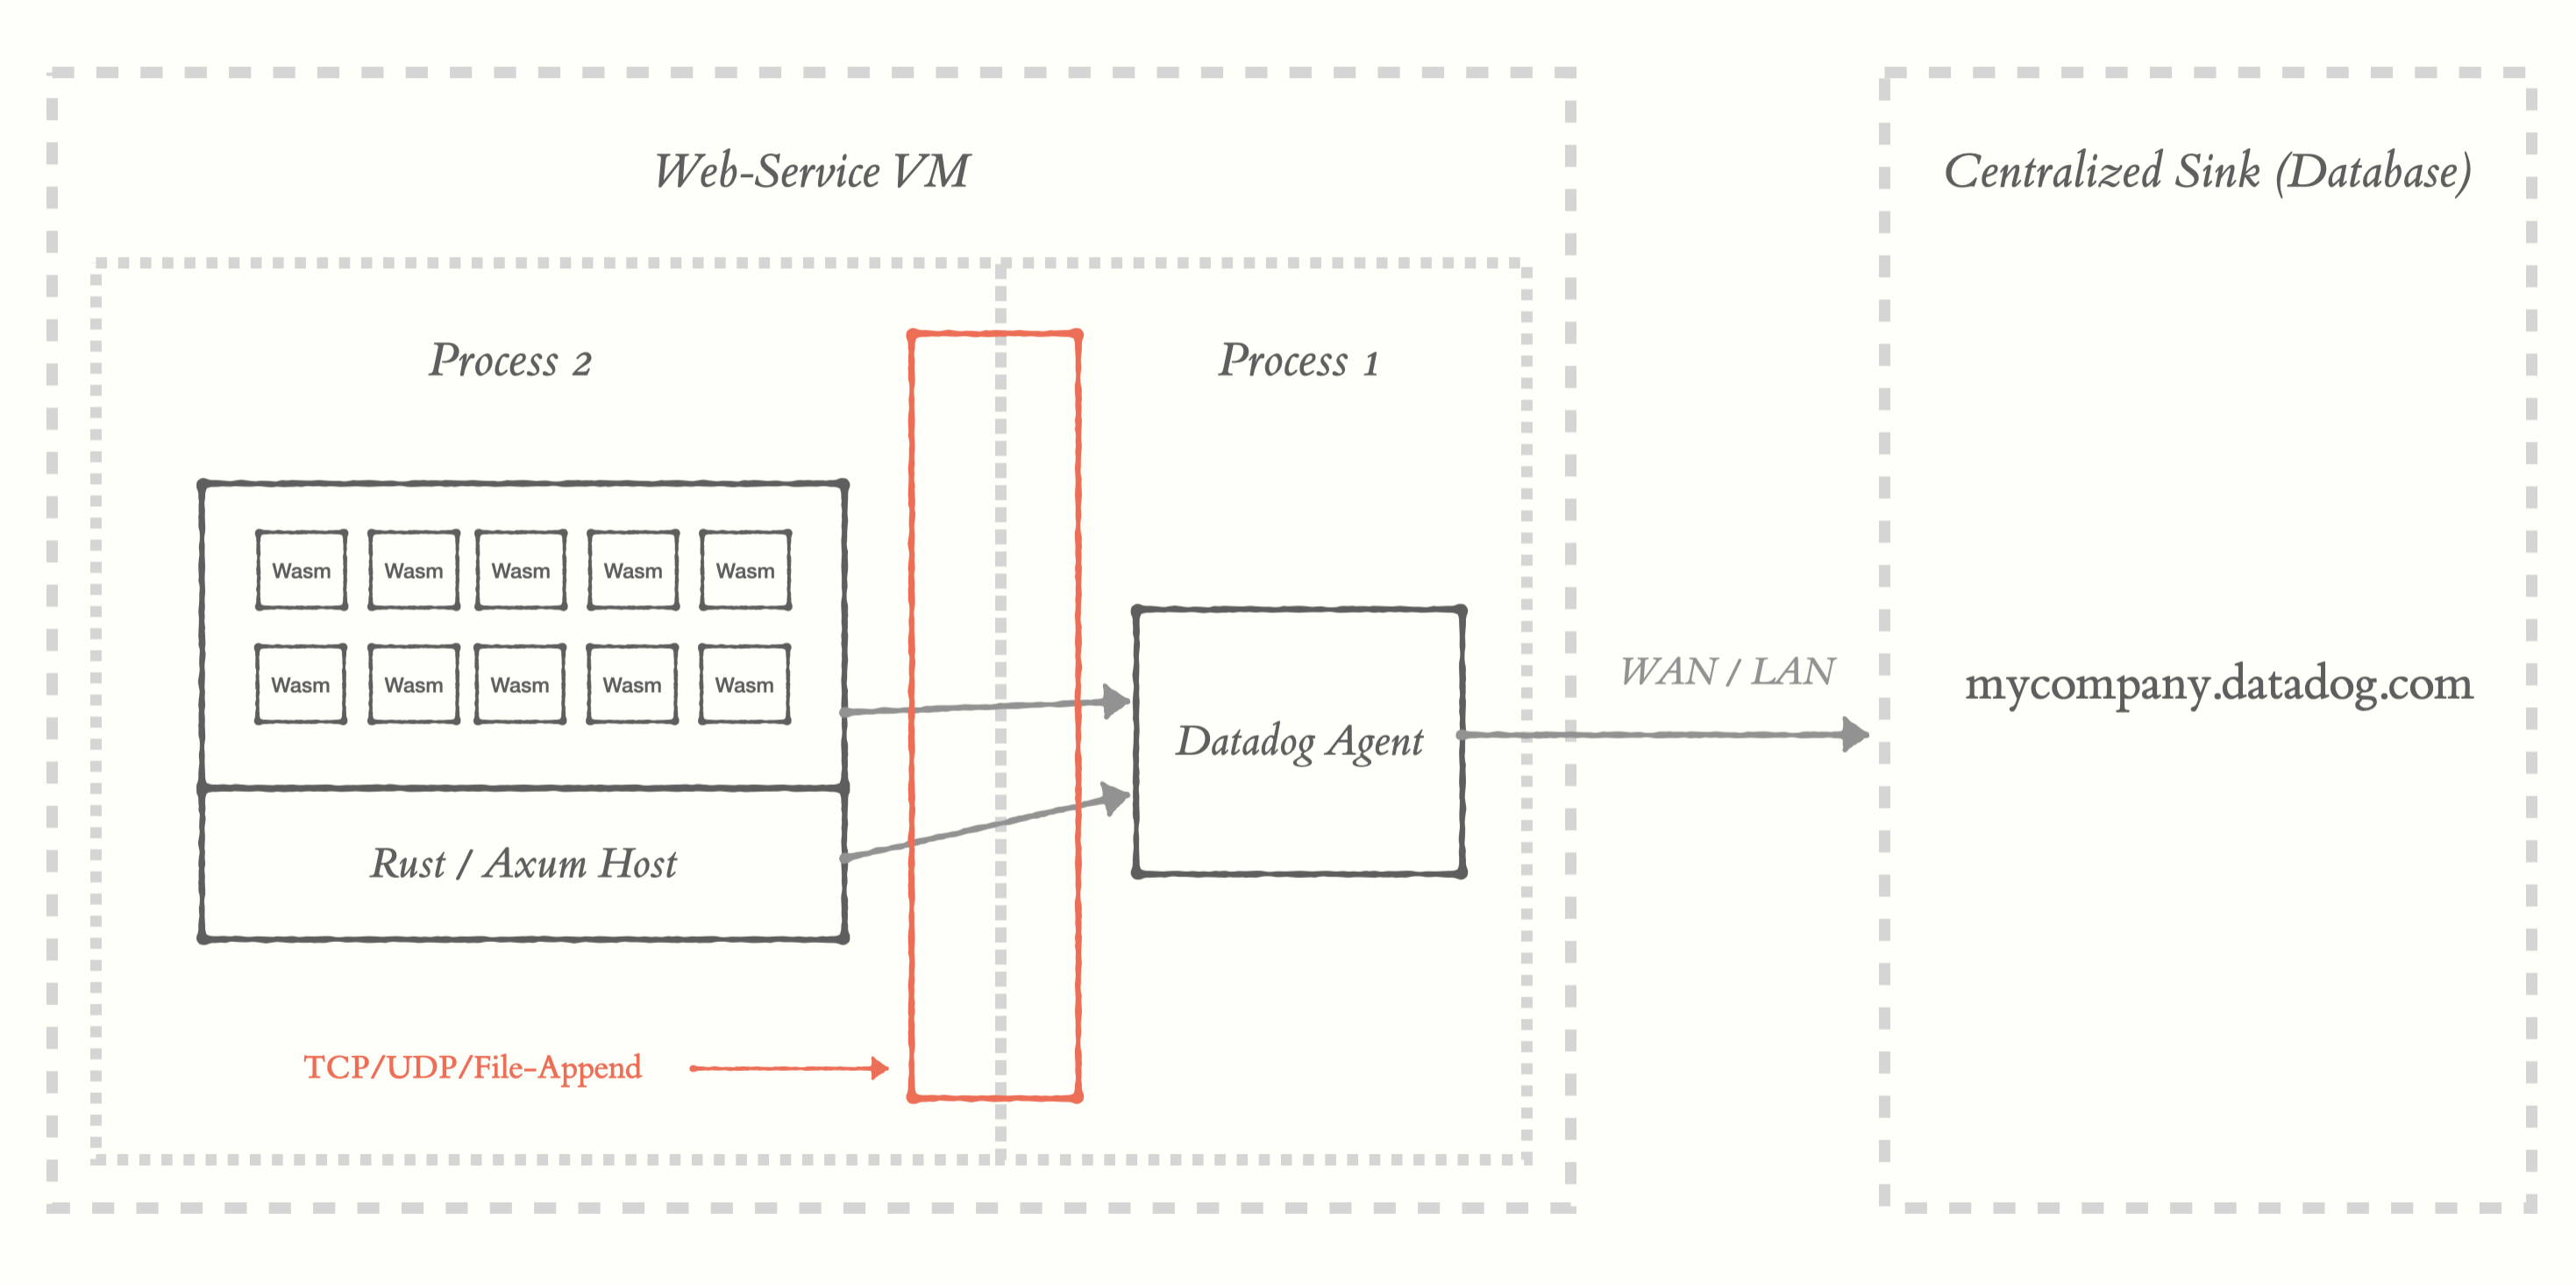
The crux of the problem lies in the realization that all of our observability tools have the assumption that they are running in a privileged linux environment. It might be surprising to learn there isn’t really a unified, simple interface for observability data.
What exists instead is what we call The Ambiguous IPC Layer. The transport protocols can include things like TCP, UDP, gRPC, file appends, etc. You also have a variety of formats coming over those wires. Everything from raw unstructured text to well known binary formats. And it’s really hard to predict which transports and formats your code will emit.
This is a challenge for Wasm. If you’re unfamiliar, Wasm, by default, can’t even make syscalls much less do high-level things like UDP. There are ways to grant these modules some of these capabilities, but there are many tradeoffs to doing so. You probably don’t want to grant some untrusted code the ability to make TCP connections to your local infra just to get some metrics out of it for example. Even if your code is trusted, you probably don’t have the ability to do non-blocking I/O and get the data out efficiently. There can also be limitations to things like high precision clocks. Obviously, these tools need accurate timing information, however handing over high precision timing to a module might open you up to some risks.
Observe Toolkit
So how do we get this telemetry out of Wasm modules? Are we stuck forever living with these tradeoffs? This is where our Observe Toolkit comes in. We believe we have a simpler path forward that allows you to easily extract telemetry in a safe and efficient way through the host / guest boundary. And this can all work without the module needing to do I/O through WASI or need access to clocks. Stay tuned for the next blog post where we will go into more details!
Whether you're curious about WebAssembly or already putting it into production, we've got plenty more to share.
We are here to help, so click & let us know:
Get in touch