Bacalhau is the Portuguese word for dried and salted cod and the central ingredient for many delicious recipes. Cod also happens to be the acronym for Compute over data (CoD), an architectural approach that inverts the traditional model of data processing by bringing computational tasks directly to where the data resides, rather than moving large volumes of data to a centralized computing location. Processing data at the source makes a lot of sense as datasets grow larger, legal complexities around data residency intensify, and the security of transferring data becomes more challenging.
And so it is fitting that Bacalhau is also the name of an open source project that champions the CoD ethos with a platform and protocol for distributed computation that brings together data, jobs that want to crunch that data and the machines that can get those jobs done. Compute jobs can travel across regions, clouds, and into edge devices to find data and process it in parallel and at scale. A Bacalhau network can be run as a decentralized, trustless group of machines or as cluster owned and managed by a company or organization. Use cases are diverse and plentiful, ranging from machine learning (training and inference), image/video processing, blockchain analysis, map/reduce jobs, etc.
The right node for the job
A Bacalhau network operates with two main types of nodes: Requester nodes and Compute nodes. Job requests are fired off from a CLI to a requester node which handles the the next step in the matchmaking process: selecting and delegating the job to a compute node that is best suited to run the computation. Perhaps the job requires a machine equipped with specialized hardware, like a GPU, or one that is nearest to where the data resides (e.g., on the same machine or in the same geographic area).
Hello, would you please you run this Wasm?
At one point in time, Docker containers were the only way to package up the code needed to run Bacalhau jobs, but WebAssembly is now supported as well. As it turns out, distributed compute and Wasm have some natural alignments and there are a few key advantages of Wasm workloads (over containerized ones) that come to mind (pardon the bias):
-
Lightweight: Wasm modules are typically much smaller than Docker containers, as they contain only the compiled code and its immediate dependencies, not an entire OS environment. This makes them quicker to load and execute, which is critical for compute-intensive tasks that need to start quickly and scale.
-
Performance: Wasm is designed for near-native performance, leveraging just-in-time (JIT) compilation or ahead-of-time (AOT) compilation. This can be more performant for certain compute-heavy tasks than running code in a Docker container that may have additional overhead.
-
Isolation & Security: Wasm provides a sandboxed execution environment that can offer strong isolation between the host system (i.e., compute node) and the running code. While Docker also provides isolation through containerization, Wasm is designed to minimize the surface area for attacks, as it runs in a constrained memory space and has very limited access to the system it runs on.
However, despite all of Wasm’s virtues, one of its key features—sandboxed execution—can also be a liability when it comes to observabiliity in this type of environment.
Wasm: The black box
Bacalhau provides comprehensive observability support, covering the three pillars: traces, logs, and metrics. Through a combination of the OpenTelemetry SDK, for metrics and traces, and some custom interfaces for logging, compute nodes are able to collect telemetry data and transmit it to any downstream Application Performance Monitoring (APM) tool or platform (e.g., Datadog, Honeycomb) that a node operator desires. This includes telemetry pertinent to the node itself and, in the case of containerized jobs, telemetry about the jobs themselves. Wasm jobs, however, present a challenge.
With its deny-by-default security model, Wasm modules simply can’t pass telemetry data to the host (i.e., the compute node) without being provided with some sort of interface to do so, and the typical observability tooling just doesn’t work out-of-the-box. This makes monitoring the behavior, performance, and health of the actual jobs that are running in the cluster difficult, if not impossible. If you’d like to go deeper into this problem statement, Dylibso CTO, Ben Eckel, has discussed these inherent challenges in depth in a previous post and given a talk on the subject.
So what’s the solve? How can a Bacalhau network capture the benefits of WebAssembly execution without losing the holistic observability story?
New tools for a new world
In it’s simplest form, what’s needed is a “channel” to heave the telemetry data across the WebAssembly host/guest boundary. In other words, a defined interface for the Wasm job (ie. the guest) to send data to its host (ie. the compute node), and an implementation on the host side to process it and send it on its merry way to be visualized, analyzed, and acted up on if necessary.
This is precisely the solution provided by the Dylibso Observe SDK, an open source project that brings observability back to WebAssembly. The SDK is supported in three languages (JavaScript, Go, Rust) and can be easily integrated into a host application in order to capture and process raw observability events from WebAssembly code during execution. Various adapters within the SDK are supported to ship all of that crunchy data to a designated APM, and the Wasm module itself can be instrumented manually or automatically with an instrumentation compiler.
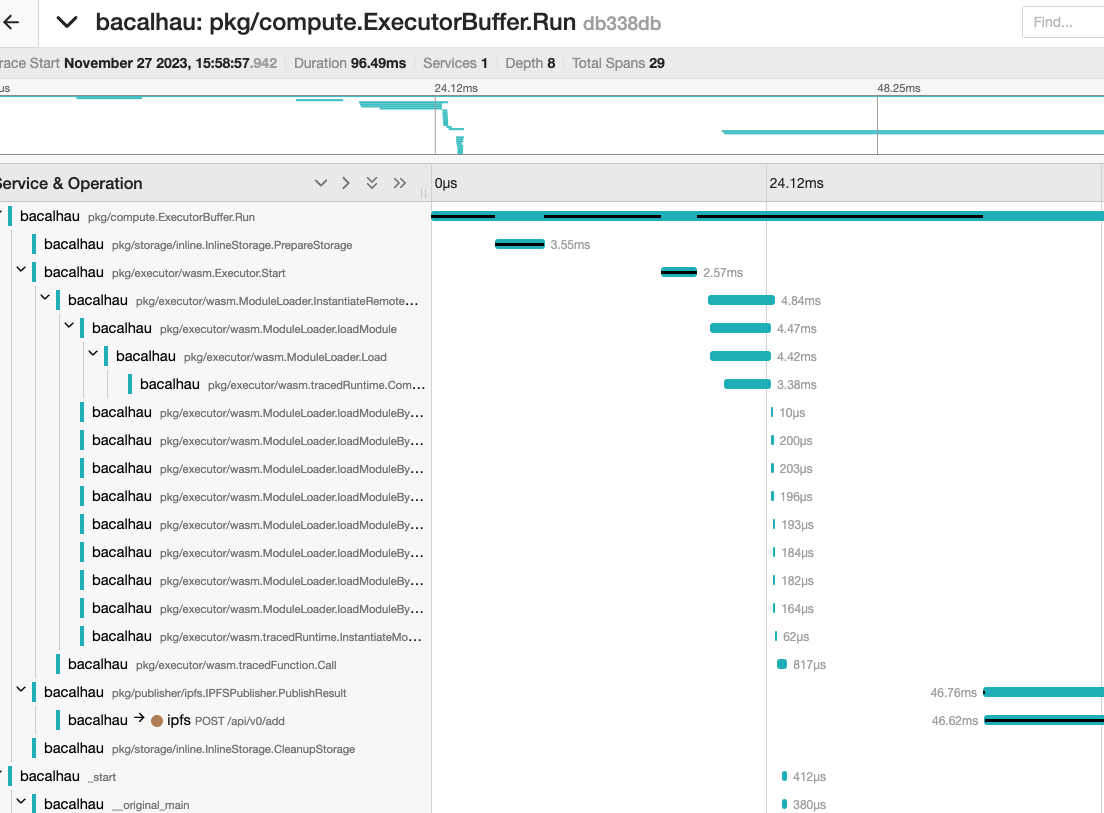
As for Bacalhau, it’s written in Go and leverages the Wazero runtime to execute WebAssembly jobs, so it was a perfect fit for the Go implementation of the Observe SDK, which snaps right into the compute node’s executor component. The SDK adapter is configured to tap into the same Otel collector used by the node, enabling the Wasm telemetry to be merged in with that of the host and consumed side by side in whichever downstream sink the operator desires.
So now you can have your distributed, compute-over-data (Wasm style) and observe it too! Go give it whirl.
And a big thanks to Expanso.io for their partnership on this integration. Dylibso loves collaborative projects like this where we get to help take the WebAssembly story to new frontiers. Give us a holler!
Whether you're curious about WebAssembly or already putting it into production, we've got plenty more to share.
We are here to help, so click & let us know:
Get in touch